What is Drag? Putting the “Critical” Back in Critical Path Analysis

The reaction to my project management books that most gratified me is been the interest in the new schedule analysis metric, critical path drag.
Experienced PMs told me that they slapped their heads when they first learned of this new measurement:
Of course! It’s so obvious, why didn’t anyone ever think of this! Why didn’t I think of it?
I have good news for them: they are still among the minority of people aware of critical path drag — most people still don’t know about it! Which is why Project Manager Today is publishing this short article as a supplement to Carl Pritchard’s interview about my books and methods.
Carl focusses on the most important part of my methodology: the concept that every project, as an investment, must be planned and tracked with ROI, the most important metric for every investment, as its pole star. But managing for maximum value and profit requires:
- Understanding how the Golden Triangle of scope, time and cost interact to generate the expected profit; and
- Managing each parameter with an eye to ROI. This requires new enhancements to the traditional techniques. Explored in depth in my books, these enhancements help manage such important factors as the value of scope, the cost of time, and progress tracking not just of earned value (which is cost-based) but of the business value measured by ROI.
But the most intuitively obvious enhancements are to scheduling metrics: critical path drag and drag cost.
Let’s start with an important distinction: there is a difference between CPM scheduling and critical path analysis.
- CPM is a technique for developing a project schedule by estimating the duration of each activity and then sequencing them in the logical order in which they can occur.
- Critical path analysis is the process of analyzing any schedule, no matter how it was originally developed – traditional CPM, resource-leveled critical path, CCPM, agile, or darts at a dartboard – in order to make improvements.
On the vast majority of project investments, expected value/ROI is impacted by completion date. Earlier completion usually leads to greater total value, faster generation of that value, and elimination of the risk of later completion! And every project’s duration will be exactly equal to its actual longest path.
So what is the most important metric of critical path analysis? It’s certainly not float, either total or free. Float is a measure of the extra time you’ve got, and is (almost always!) on activities that are, specifically, off the critical path.
If critical path analysis is intended to help increase the value of the project investment by shortening the schedule (perhaps up front, perhaps after slippage), then the most important metric is surely one that applies to the longest path! To be precise, it’s a metric that will help the project team identify how much time each critical path activity, constraint, resource bottleneck, sprint, stumble, dropped baton, rework, or other delaying factor is adding to the remaining project duration! It’s the one that, when changes are made to pull in the longest path (thus making another path longest), will identify how much time each item on the new CP is delaying completion!
Pm today straight to your inbox
subscribe
hat metric is critical path drag. It is, by far, the second most important (critical?) metric in critical path analysis. Why only the second most important? Because the most important is drag cost, i.e., how much is the drag of a critical path item reducing your project’s expected business value. That is the most important metric because that’s the one that will allow the project team to optimize the project investment (the ultimate goal of every project!) by justifying the cost of resources by $X to reduce the drag cost by $2X!
But of course you can’t get drag cost until you’ve first computed drag.
One more important point: I did not invent drag! Drag is always there, and has always been there – on the items (activities, etc.) on the longest path of every project, going back to the building of the pyramids and before! We can compute it or we can ignore it – but it’s still there! And it should be important to every project manager and scheduler.
Computing Critical Path Drag
Computing drag in a large and complex network, with lags and precedence diagram method (PDM) dependencies such as start-to-start (SS), finish-to-finish (FF) and start-to-finish (SF) relationships, is not simple. Indeed, it’s exactly the sort of task designed for which computers are designed! (And for those without such software, I explain the method of such computation in my 2015 book Total Project Control: A Practitioner’s Guide.)
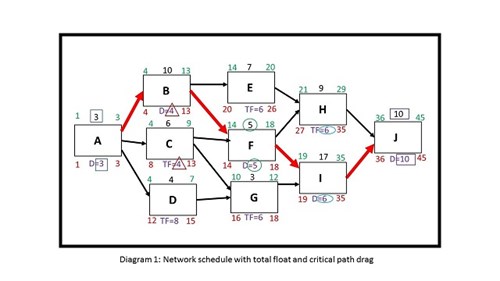
But even though most software packages don’t “do” drag, such computation is important! So for this short article, here is a quick lesson in computing critical path drag in Diagram 1 with all finish-to-start (FS) relationships.


